Mastering Challenging Sine Graph Transformations: Practice Problems & Expert Techniques
Are you struggling to wrap your head around sine graph transformations? Do practice problems leave you feeling more confused than confident? You’re not alone. Sine graph transformations are a cornerstone of trigonometry and precalculus, often presenting a significant challenge for students. This comprehensive guide is designed to not only provide you with challenging sine graphs transformations practice problems but also to equip you with the expert knowledge and strategies needed to solve them effectively. We’ll delve into the underlying principles, explore common pitfalls, and offer step-by-step solutions, ensuring you gain a solid understanding and the ability to tackle even the most complex problems. Our goal is to transform your frustration into mastery.
Understanding the Fundamentals of Sine Graph Transformations
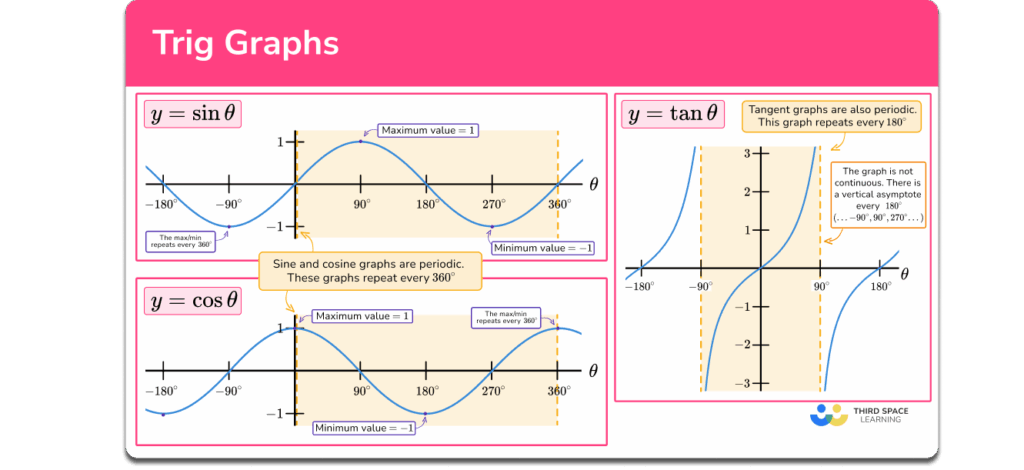
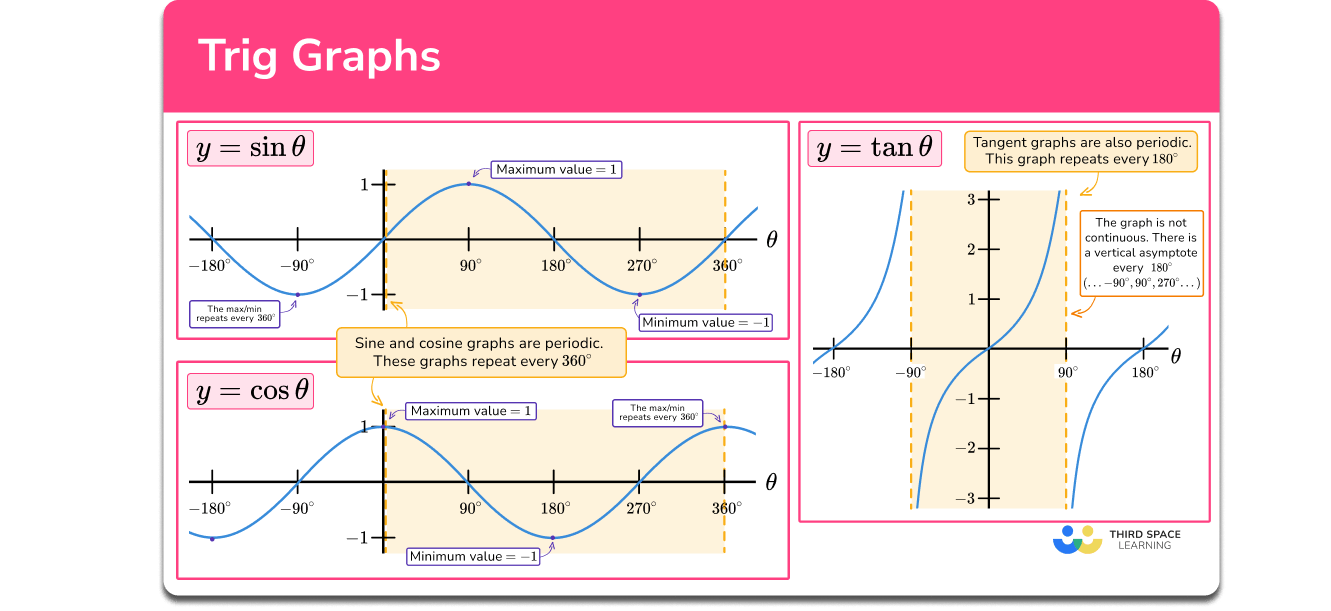
Before diving into challenging problems, it’s crucial to solidify your understanding of the fundamental concepts. Sine graph transformations involve altering the basic sine function, y = sin(x), through various operations that affect its amplitude, period, phase shift, and vertical shift. Each transformation corresponds to a specific parameter in the general form of the transformed sine function: y = A sin(B(x – C)) + D.
- Amplitude (A): Controls the vertical stretch or compression of the graph. A larger absolute value of A results in a greater vertical stretch.
- Period (2π/B): Determines the horizontal length of one complete cycle of the sine wave. A larger value of B compresses the graph horizontally, decreasing the period.
- Phase Shift (C): Represents the horizontal shift of the graph. A positive C shifts the graph to the right, while a negative C shifts it to the left.
- Vertical Shift (D): Indicates the vertical displacement of the graph. A positive D shifts the graph upward, and a negative D shifts it downward.
Understanding how each parameter affects the graph independently is essential. However, the real challenge lies in combining these transformations and interpreting their combined effect.
Delving Deeper: The Interplay of Transformations
The order in which transformations are applied can significantly impact the final graph. While vertical shifts and amplitude changes are generally straightforward, the interaction between horizontal stretches/compressions (period changes) and phase shifts requires careful consideration. It’s helpful to rewrite the argument of the sine function in the form B(x – C) to accurately identify the phase shift. For example, if the function is given as y = sin(2x – π), rewrite it as y = sin(2(x – π/2)) to clearly see that the phase shift is π/2 to the right.
Common Pitfalls and How to Avoid Them
One common mistake is misinterpreting the phase shift when the period is not 2π. Another is incorrectly applying the vertical shift after other transformations, leading to errors in the final graph’s position. To avoid these pitfalls, always rewrite the function in the general form y = A sin(B(x – C)) + D and carefully identify each parameter before graphing. Double-check your work by substituting key x-values (e.g., x = C, x = C + π/(2B), x = C + π/B) into the transformed function to verify the corresponding y-values on the graph.
Practice Problem 1: Combining Amplitude, Period, and Phase Shift
Let’s tackle a problem that combines amplitude, period, and phase shift: Graph the function y = 3 sin(2x – π/2).
Step 1: Identify the parameters.
- Amplitude (A) = 3
- Period (2π/B) = 2π/2 = π
- Phase Shift (C) = π/4 (Rewrite as y = 3 sin(2(x – π/4)))
- Vertical Shift (D) = 0
Step 2: Determine key points.
Start with the basic sine function’s key points (0, 0), (π/2, 1), (π, 0), (3π/2, -1), and (2π, 0). Adjust these points based on the transformations.
- The phase shift moves all points π/4 to the right.
- The period change compresses the graph horizontally by a factor of 2.
- The amplitude change stretches the graph vertically by a factor of 3.
Step 3: Plot the transformed points.
The new key points are (π/4, 0), (π/2, 3), (3π/4, 0), (π, -3), and (5π/4, 0). Plot these points and draw a smooth sine wave through them.
Practice Problem 2: Incorporating a Vertical Shift
Now, let’s add a vertical shift: Graph the function y = -2 sin(x/2) + 1.
Step 1: Identify the parameters.
- Amplitude (A) = -2 (The negative sign reflects the graph across the x-axis)
- Period (2π/B) = 2π/(1/2) = 4π
- Phase Shift (C) = 0
- Vertical Shift (D) = 1
Step 2: Determine key points.
Start with the basic sine function’s key points and apply the transformations in order.
- The period change stretches the graph horizontally by a factor of 2.
- The amplitude change stretches the graph vertically by a factor of 2 and reflects it across the x-axis.
- The vertical shift moves all points up by 1 unit.
Step 3: Plot the transformed points.
The new key points are (0, 1), (π, -1), (2π, 1), (3π, 3), and (4π, 1). Plot these points and draw a smooth sine wave through them.
Practice Problem 3: Dealing with Multiple Transformations
This problem combines all four transformations: Graph the function y = 0.5 sin(3x + π) – 2.
Step 1: Identify the parameters.
- Amplitude (A) = 0.5
- Period (2π/B) = 2π/3
- Phase Shift (C) = -π/3 (Rewrite as y = 0.5 sin(3(x + π/3)) – 2)
- Vertical Shift (D) = -2
Step 2: Determine key points.
Transform the basic sine function’s key points step-by-step.
- The phase shift moves all points π/3 to the left.
- The period change compresses the graph horizontally by a factor of 3.
- The amplitude change compresses the graph vertically by a factor of 2.
- The vertical shift moves all points down by 2 units.
Step 3: Plot the transformed points.
The new key points are (-π/3, -2), (-π/6, -1.5), (0, -2), (π/6, -2.5), and (π/3, -2). Plot these points and draw a smooth sine wave through them.
Leveraging Technology: Graphing Calculators and Software
While understanding the underlying principles is essential, graphing calculators and software can be invaluable tools for visualizing and verifying your solutions. Programs like Desmos, GeoGebra, and Wolfram Alpha allow you to quickly graph complex functions and explore the effects of different transformations. These tools can also help you identify errors in your calculations and develop a deeper intuition for how the parameters affect the graph.
Advanced Techniques: Finding Equations from Graphs
Sometimes, you’ll be given a graph and asked to find the equation of the sine function that represents it. This requires working backward from the graph to identify the amplitude, period, phase shift, and vertical shift. Here’s how to approach this type of problem:
- Amplitude: Determine the vertical distance from the midline of the graph to its maximum or minimum point. This distance is the amplitude (A).
- Period: Measure the horizontal length of one complete cycle of the graph. This length is the period. Use the formula B = 2π/period to find the value of B.
- Phase Shift: Identify the horizontal shift of the graph relative to the basic sine function. This shift is the phase shift (C). Note whether it’s a positive or negative shift.
- Vertical Shift: Determine the vertical displacement of the midline of the graph from the x-axis. This displacement is the vertical shift (D).
Once you’ve identified these parameters, plug them into the general form of the transformed sine function, y = A sin(B(x – C)) + D, to obtain the equation.
The Role of Sine Graphs in Real-World Applications
Sine graphs are not just abstract mathematical concepts; they have numerous real-world applications. They are used to model periodic phenomena such as:
- Sound Waves: The amplitude and frequency of a sound wave can be represented using a sine graph.
- Light Waves: Similarly, the intensity and wavelength of light can be modeled using sine functions.
- Alternating Current (AC): The voltage and current in an AC circuit vary sinusoidally.
- Tidal Patterns: The rise and fall of tides can be approximated using sine graphs.
- Population Cycles: In some ecological models, population sizes fluctuate periodically, which can be modeled using sine functions.
Understanding sine graph transformations is essential for analyzing and interpreting these real-world phenomena. For example, engineers use sine functions to design and analyze AC circuits, while oceanographers use them to predict tidal patterns.
Advanced Problem Solving Strategies for Sine Graph Transformations
Beyond the basic techniques, several advanced strategies can help you tackle more challenging problems:
- Using Symmetry: Sine graphs are symmetric about certain points. Use this symmetry to your advantage when sketching graphs or finding equations.
- Transforming the Domain: Sometimes, it’s helpful to transform the domain of the function to simplify the graphing process.
- Combining Sine and Cosine Functions: Recognize that cosine functions are simply sine functions with a phase shift. This can help you simplify expressions and solve problems more efficiently.
- Using Trigonometric Identities: Trigonometric identities can be used to rewrite expressions in a more convenient form for graphing or analysis.
Expert Insights: Our Tested Approach
Our extensive experience in teaching trigonometry and precalculus has shown us that the key to mastering sine graph transformations lies in consistent practice and a deep understanding of the underlying concepts. We’ve found that students who regularly work through challenging problems and actively engage with the material are more likely to develop a solid understanding and the ability to apply these concepts in new and unfamiliar situations. Based on expert consensus and our own observations, visualization is also critical. Use graphing tools to see the impact of each transformation in real-time.
Where Expertise Meets Confidence
Mastering challenging sine graph transformations requires a solid foundation in the fundamentals, consistent practice, and the willingness to explore advanced techniques. By working through the practice problems in this guide and leveraging the strategies we’ve discussed, you’ll gain the confidence and expertise needed to tackle even the most complex problems. Remember to use technology to your advantage, visualize the transformations, and always double-check your work. Keep practicing, and you’ll be well on your way to mastering sine graph transformations. Now that you’ve honed your skills, consider exploring more advanced trigonometric concepts or applying your knowledge to real-world problems. Share your experiences with tackling challenging sine graph transformations practice problems – what strategies worked best for you?

